


-2.svg)


-1.svg)


There are different types of organization charts ('org charts') and each serves a slightly different purpose. Most commonly, their purpose is to show a graphic representation of an organization’s structure, its reporting lines, departments, accountabilities and hierarchy.
Organization charts can map a company’s entire employee structure or simpler versions can show internal segments such as certain functional areas, departments, or workgroups. They can also be arranged to show tasks, responsibilities, and relationships.
Simply put, an org chart will show you the 'skeleton' of the company or organization, how it all fits together, who does what (in overall terms), without necessarily telling you how things get done.
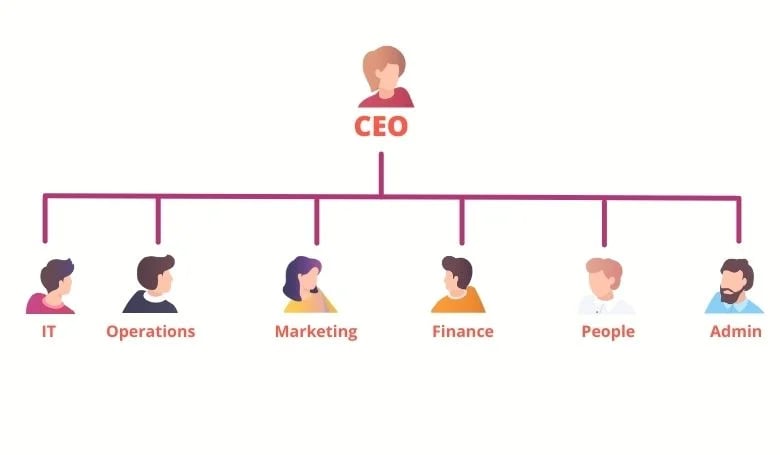
A Simple Org Chart
The Benefits of Using Org Charts
Organizations use org charts for several reasons, including:
- Defining clear lines of reporting within an organization
- Clarifying roles and responsibilities
- Creating a framework for accountability
- Helping with resource allocation
- Helping visualize structure
- Preventing duplication of work
- Aiding in balancing workloads
Org charts are also a good way to visualize the current and possible future structure of your company as it grows or evolves. During planning and forecasting, an org chart can help you see gaps in your staffing or resource allocation.
It also helps you see the impact of moving people or functions can have on the structure of your organization as a whole.
Different Types of Org Charts
There are several types of org charts that are most commonly used, including:
- Hierarchy charts
- Functional org chart
- Cross-functional org chart
- Dotted line org chart
- Matrix org chart
- Accountability chart
- Entity diagrams
- Organigram
1. Hierarchy Charts
A hierarchy chart is what you might traditionally think of when you envision an organizational chart. In businesses, it may resemble a staffing chart with the boss at the top, managers underneath, and subordinates underneath the managers. Lines connect the different employees to define the reporting structure.
A hierarchical structure is also common in education to explain complex issues or information. For example, using a hierarchy chart, you can show animal taxonomy branching off into different divisions, such as kingdom, phylum, class, genus, and species. Individual animals would then be listed underneath each division.
The simplest version is what’s called a flat organizational chart. This is the type of org chart typically used in very small companies or startups. At the top would site the owner or founder. With no additional layers of management, all employees would report to the owner or founder.
A Tall versus a Flat organization
.jpg?width=780&name=F%20internal%20-%20780%20x%20455%20(1).jpg)
For more on hierarchical org charts, please read this article.
2. Functional Org Chart
A functional org chart features a top-down hierarchy but instead of focusing on positions and management layers, it groups employees by functional skills.
For example, employees may be grouped by department or area of specialization. Each area will have a manager or lead.
Each department or area runs in a vertical direction from top to bottom. The manager or lead may be on a horizontal plane and report to top management. Departments or areas in this model tend to work independently of each other, coming together at the manager level when outside expertise is required.
Employees aren’t always grouped by department, however. Another way to use a functional org chart is to group employees by knowledge and skills.
For more on functional org charts, please read this article.
3. Cross-Functional Org Chat
A cross-functional org chart, also called a 'matrix' organizational chart, details how employees are organized into a team by projects or products. While workers may still report to a functional manager, such as a department head, they have other reporting lines that show their accountability to project leads.
Team members may still be accounted for in a traditional organizational hierarchy, such as by departments, but may show up in multiple places in a cross-functional org chart to indicate their responsibilities for various projects or products. In these organizations, team members with cross-functional skills are especially valuable.
For more on cross-functional org charts, please read this article.
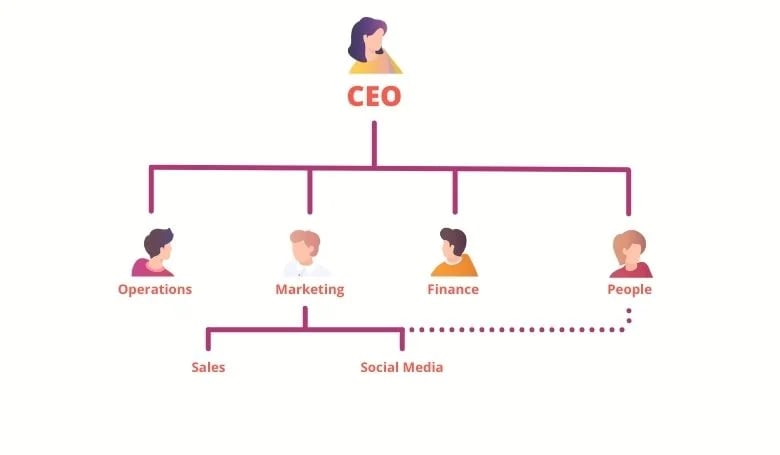
4. Dotted Line Org Chart
A dotted line org chart shows the relationship of employees outside their functional areas. For example, an employee might be in the marketing department, but also have responsibilities to deliver marketing that generates qualified sales leads. They might have a dotted line report to the sales manager.
A solid line from manager to employee delineates a clear line of reporting. Managers set the objectives and monitor outcomes while managing employees under them to get the work done. With dotted line reporting, employees report to multiple managers or leads.
A dotted line shows additional relationships outside a functional area
For more on dotted line org charts, please read this article.
5. Matrix Org Chart
A matrix organizational chart divides employees into teams by projects or products. While employees may also report to a functional manager, workers have responsibilities across departments to collaborate on projects.
A matrix org chart is often used when organizations are juggling multiple projects and have to move resources frequently. It can facilitate better and more open communication across functional areas and allow for rapid reassignment when needed.
While a hierarchal chart goes from top to bottom, a matrix org chart is laid out more like a grid. Employees with similar skills or expertise are grouped together for related tasks and may have multiple lines of reporting.
For more on matrix org charts, please read this article.
6. Accountability Chart
An accountability chart doesn’t chart organizational structure. Instead, it graphs ownership of responsibilities. An efficient accountability chart template allows organizations to create a clear view of the major functions within an organization, the primary roles for employees, and the areas of responsibility.
In an accountability chart, people don’t have titles, but they should know what jobs need to get done, by whom.
For more on accountability charts, please read this article.
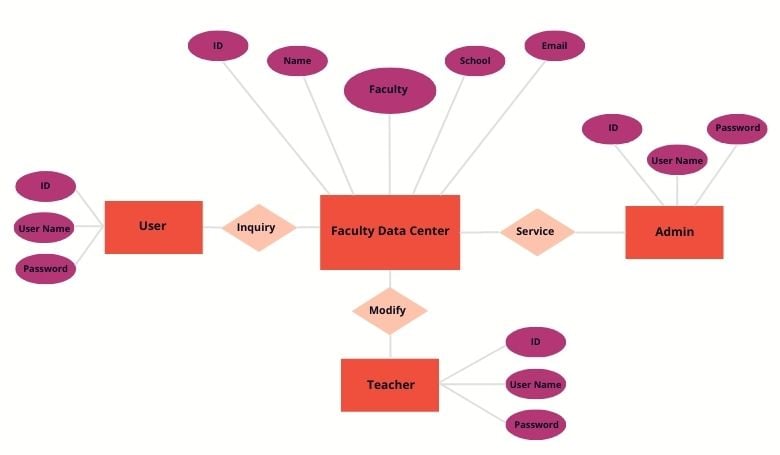
7. Entity Relationship Diagrams
An entity relationship diagram shows how people, objects, or concepts relate to each other within a process or system. Entity diagrams are commonly used in software engineering, business information, education, and research for mapping and modeling. For example, a developer may use an ERD to show data pathways in a relational database and how it flows in a system or process.
An Entity Relationship Diagram
For more on entity relationship diagrams, please read this article.
8. Organigram
You may hear someone refer to an organigram, organogram, or organigrama. These are versions of different types of hierarchal org charts.
The organogram definition includes:
- Hierarchical Organogram: A top-down approach where everyone is subordinate to others except for the top person in the organization.
- Matrix Organogram: Pools people with related skills to work on projects that may cross-functional reporting areas
- Flat Organogram: Also called a horizontal organogram, this org chart has few (or no) levels of management between staff and leaders.
For more on organigrams, please read this article.
 : Stop Doing Org Charts Manually!
If you’re creating org charts manually or using spreadsheets to build them, it can be very time-consuming and frustrating. Just as soon as you get them completed, someone leaves the company or shifts into a new role and your work is out of date.
What is written down may bear little resemblance to what actually happens in the company, and they are left in some folder somewhere, rarely viewed or updated.
There is a better way to create and manage whatever type of org chart you want to build.
Functionly creates intelligent org charts to help you navigate the future. You can update them online, in real-time. You can share them with managers and staff. You can start with a comprehensive template.
Because Functionly integrates with most major HR and payroll platforms, you can import employee information to save time. Drag and drop mapping lets you move people into different configurations. You can also see real-time reporting against your org charts, so you can see at a glance headcounts, vacancies, and team metrics. Gaps and overlaps are easy to spot.
Functionly makes it simple to create beautiful org charts that are clear and easy to understand, whether they are traditional organizational charts or you need to track unique workflows where people and jobs function in multiple roles.
Want to see Functionly in action? You can get started today, for free.

