


-2.svg)


-1.svg)


There is no question that Microsoft PowerPoint is an excellent tool for creating engaging presentations.
The intuitively designed software allows you to seamlessly combine text, images, and video clips into a detailed presentation for your staff.
However, like many other Microsoft software solutions, PowerPoint features several other auxiliary capabilities, including the ability to create org charts.
Short for “organizational charts,” org charts are graphical representations of your company’s organizational hierarchy. These charts detail the various departments and teams within the company. Furthermore, an org chart will outline the responsibilities of each of these teams.
The best org charts provide a visual representation of your company’s hierarchy and can be used to identify responsibility overlaps, connect teams to managers, and improve interdepartmental collaboration.
Can I Use PowerPoint for Org Charts?
Yes, PowerPoint can be used to create org charts. The platform makes it quite easy to create and customize org charts for your business. You can create org charts as standalone files or incorporate them into existing slide show presentations. Below, we provide a step-by-step guide for crafting an org chart in PowerPoint.
How to Create an Org Chart in PowerPoint
Once you open a PowerPoint presentation, you can create an org chart by following a few simple steps:
1. Click Insert, Then SmartArt
At the top menu, click on the “Insert” submenu. Next, select “SmartArt.” This action will open up a vertical submenu. Scroll down and select “Hierarchy,” then click on “org chart” in the fly-out menu that appears.
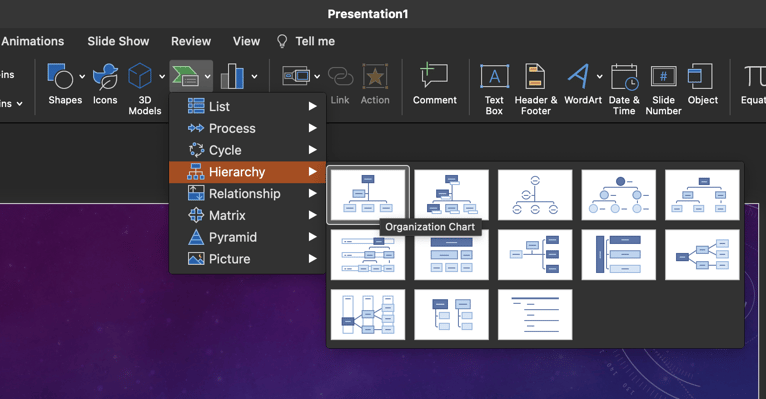 Select "Hierarchy" from the SmartArt menu and choose "Organization Chart."
2. Adding Job Titles
After your chart populates, you will need to start adding job titles and/or employee names in the shapes on the chart. To keep things simple, we suggest starting at the top of the organizational hierarchy and working your way down.
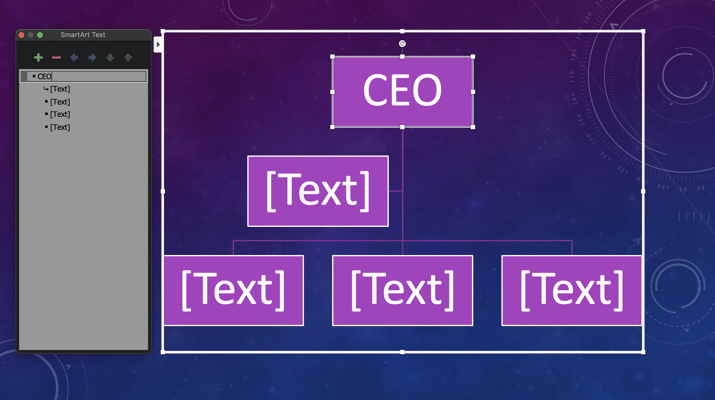 Add text in the shapes using the SmartArt Text box.
3. Adding Shapes
Chances are that the generic org chart will not have enough shapes to accommodate all of your employees and job descriptions. As a result, you will need to manually add more shapes as you work your way down the chart.
To add a shape, hold down the “Control” button and right-click on a shape. This action will bring up a new menu. Hover your cursor over the “Add Shape” option on this menu and then select the appropriate action. You will be able to add the new shape above, below, before, or after the shape that you originally clicked on.
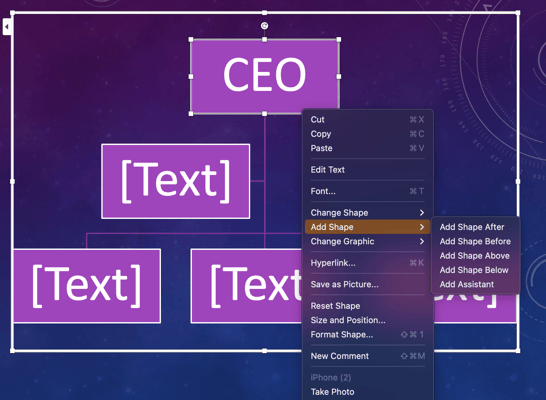 Use the "Add Shape" menu option to add more boxes to your org chart.
Alternatively, you can click on the “+” icon in the SmartArt section of the window. This section is usually located on the right side of the screen.
You can also subtract shapes from your PowerPoint org chart. This removal can be accomplished in a similar manner to adding shapes. The easiest of your two options involves clicking on the shape you want to remove and then selecting the “-” symbol from the SmartArt menu.
If you are savvy with hotkeys and shortcuts, holding “Control” and right-clicking on a shape will also allow you to delete it. After you open the submenu, simply select “Delete Shape” instead of “Add Shape.”
4. Formatting the Chart
The SmartArt tools will be your best ally when creating PowerPoint org charts. During the final step, select the “SmartArt Design” tab at the top of the screen. This action will allow you to alter fonts and color schemes in order to make your org chart more aesthetically pleasing.

When selecting formatting options, you should generally choose colors and fonts that align with your other internal communication materials. However, do not overdo it, as this can negatively impact the readability of your org chart.
After you have completed your org chart, you can go back and make formatting updates. However, making significant structural updates can be quite tedious and time-consuming. Frequently, it is easier to simply start from scratch.
Should I Leverage PowerPoint Org Charts
PowerPoint org charts can effectively convey information about your organizational hierarchy and help employees better understand their roles within the company.
These org charts can easily be incorporated into slide show presentations, such as those that are displayed during onboarding sessions, recruiting and outreach efforts, and meetings among senior executives.
PowerPoint’s org chart creation tools are appealing because they are easily accessible. Your company, like thousands of others around the globe, probably already has a Microsoft Office software license. If so, then you can begin using PowerPoint to create org charts without incurring any additional expenses.
Additionally, PowerPoint org charts are easy to create. They can also be relatively useful, provided that you update them regularly.
Now for the bad news. PowerPoint org charts are not easy to update, share, or distribute. They lack a dynamic element and function as little more than a visual aid. As a result, you are gaining minimal insight into your organizational hierarchy, responsibility overlap, and the functions of various departments or teams.
PowerPoint org charts cannot be used to map out functions, create job descriptions, or perform other dynamic tasks. It is also quite difficult to export PowerPoint org charts while still restricting edit access to authorized users.
The bottom line is that PowerPoint org charts can easily be incorporated into slide shows. They are also more interactive and visually appealing than org charts made in other Microsoft platforms like Word or Excel. PowerPoint org charts are certainly better than nothing, but that is the extent of their usefulness.
Why Functionly Is a Better Alternative
If your organization wants to leverage the true potential of org charts, then you need to adopt a solution like Functionly. Our feature-laden platform allows you to precisely map out the functions of teams and departments in order to identify gaps or overlaps.
You can use these capabilities to facilitate improved internal alignment and optimize collaboration between various teams.
Additionally, Functionally allows you to create comprehensive job descriptions that highlight the responsibilities of each role within your organization. Our export tool allows you to create these descriptions in just 30 seconds.
Take advantage of our free 22-day trial and start using the Functionly platform today.

