


-2.svg)


-1.svg)


An entity relationship (ER) diagram shows how people, objects, or concepts relate to each other within a process or system.
Entity diagrams are commonly used in software engineering, business information, education, and research for mapping and modeling.
For example, a developer may use an ER diagram to show data pathways in a relational database and how it flows through a system.
They are similar to a data structure diagram (DSD). While DSDs depict the relationship of elements within entities, ER diagrams show the relationship between entities.
Therefore, ER diagrams serve a very different purpose to organization charts.
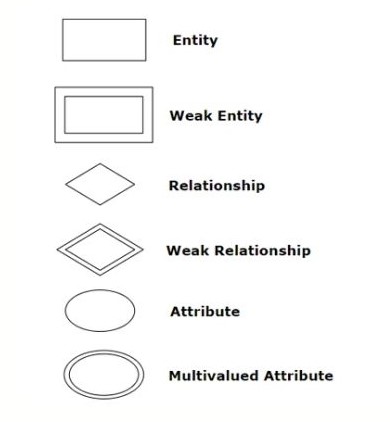
Symbols Used in ER Diagram
ER models use a set of entity shapes (symbols) that describe the relationship between entities. This includes errors and connectors, along with the use of nouns to describe entities and verbs to show relationships.
Here are the most common:
Source: SmartDraw (link shown below)
Entities
Entities are represented by rectangles — an object or concept that you want to store information. There are two different entity types as well.
Strong entities are not dependent on any other entity within your schema. It will be represented by a single rectangle and always has a primary key.
Weak entities are dependent on a strong entity. In other words, without a relationship to a strong entity, it would not exist. Also known as an identifying relationship, a weak entity is depicted as a double rectangle.
Actions
An action is represented by a diamond shape, which shows how entities share information within a database. Relationships between strong entities and weak entities in entity sets are depicted by using a double diamond shape.
In some cases, entities may be self-linked, such as the case when a manager supervises employees.
Attributes
An attribute is the unique characteristics of an entity and is depicted by an oval. An employee’s ID number or social security number might be the data inside an attribute,
There are also different types of attributes.
A multivalued attribute contains more than one value and is shown as a double oval. An example would be when you are listing the multiple skills an employee has.
A derived attribute is one that is based on another attribute. It is depicted by a dotted-line oval. An example would be an employee's pay, which is determined by the number of hours worked.
Relationships
Relationships between entities are shown using solid lines. Depicted on lines is what’s called 'cardinality'. Cardinality helps users understand how many instances of an entity relate to another.
There are several ways this is expressed, although the most common is the information engineering style, which shows relationships as:
- One to one
- One to many (mandatory)
- One or more (mandatory)
- One and only one (mandatory)
- Zero or one (optional)
- Zero or many (optional)
- Many
- Many to many
"Cardinality"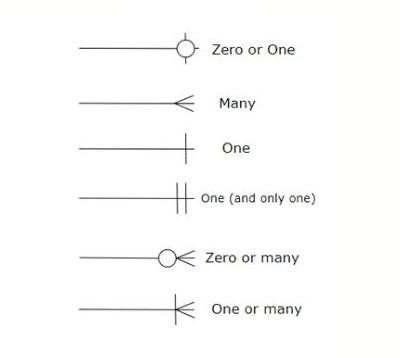 Source: SmartDraw (link shown below)
Other ways of defining relationships are the Bachman style, Chen style, Barker style, or Martin style, which use different symbols or numbers to define relationships.
Use Cases for Entity Diagrams
Entity relationship diagrams are used in a variety of different ways in different industries. Here are a few examples of how ER diagrams might be used:
Research
Research often starts with a large volume of raw data that needs to be cleansed to be useful. Using an ERD, researchers can better organize their structured data to create a database of usable data.
Business Information System
An efficient business information system requires streamlined and efficient processes. It helps managers to understand the complex interdependencies between entities.
Database Design and Troubleshooting
Entity relationship diagrams are created to design a relational database and help to define the requirements and structure for information systems. ERDs can demonstrate these different types of models.
- Conceptual data model: A high-level view that shows less detail and shows the overall architecture of the system.
- Logical data model: Includes logic and business rules that define interdependencies and are more detailed and defined.
- Physical data model: Includes the technology that needs to be deployed to produce the database or results.
ERDs are commonly used in conjunction with a data flow diagram and can also be helpful when troubleshooting problems in a database. For example, when there is a disconnect between logic and result, an ER diagram can help in showing the relationships to narrow down what relationships are missing or incomplete.
Software Engineering
ER diagrams are used in software engineering during the early stages of planning projects. They help to identify the different elements and define relationships.
Education
Entity relationship diagrams are used in education to visually represent the relationships between students, teachers, and schools. ERDs can also be used to maintain relationships between entities related to educational drivers.
ER Diagram (Education)
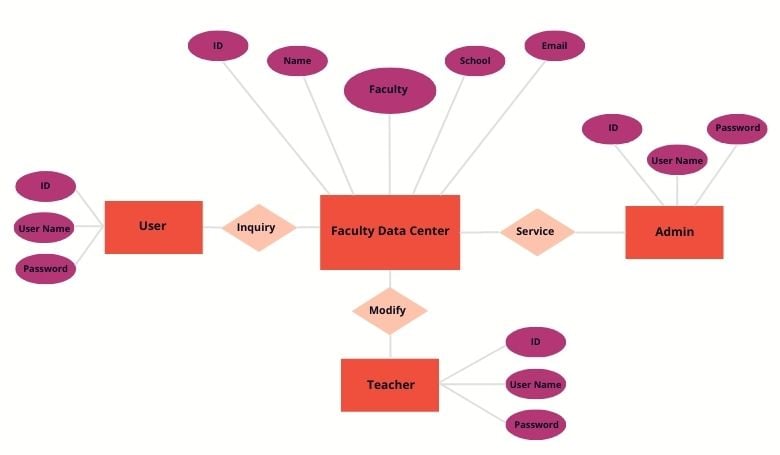
Original Source Concept: EDraw Max
How to Create an Entity Relationship Diagram
An efficient ER diagram can help you understand the relationships between each and every entity within your system, process, or organization. Here is a simplified step-by-step guide on how to create an entity relationship diagram manually.
Before you begin, you want to think about the purpose of drawing an ERD. This will help you decide whether you want to build a conceptual, logical, or physical model and the right level of detail you need to add.
Step One: Identify the Entities
The first step is to identify the entities that will be used within your diagram. Each entity should be depicted as a rectangle and a description of the information that will be stored within each rectangle. You will want to show them on a page, but spread them out so there is room between them to show relationships.
Step Two: Identify Relationships
Next, you need to look at each entity and decide if they have a relationship. If they do, you draw a solid line connecting them.
Step Three: Describe the Relationship
In this step, you are depicting how the entities are related. Draw an action diamond between the two entities and include a short description of how the relationship works.
Step Four: Add Attributes
Next, use oval-shaped symbols to add any key attributes associated with entities.
Step Five: Repeat until Complete
Finally, you will want to continue to examine each entity and look for associations. Continue to add relationships and describe them. Be aware that some entities will be stand-alone without any relationships, while others may have multiple relationships.
Step Six: Review
After you’ve completed your ERD, you will need to review it for accuracy.
Some common mistakes include:
- Missing entities or entities that appear in more than one place
- Missing names or descriptors for entities, relationships, or attributes
- Missing, unnecessary, or redundant relationships
- Connecting relationships to each other
An important step in this review is to examine each relationship to see if there is a more efficient solution to define the relationship or to reduce redundancies.
You may also want to consider adding colors to highlight the important parts of your ERD to make them stand out.
Benefits and Limitations of Entity Relationship Modeling
ER diagrams are ideal for many scenarios, but there are limitations. For example, ERDs are not the best way to diagram the structure of an organizational chart.
Here are some of the top benefits and limitations of entity relationship diagrams.
Benefits of ERDs
- Creates a visual representation of a database or process structure that can be understood by looking at the diagram.
- Standardization of symbols helps define the intricacies of the relationships more clearly.
- Can be converted into other data models
- Provides a roadmap for troubleshooting
- Works well with structured data
- Can help you determine gaps in structure or resources
Limitations of ERDs
- Does not work well with unstructured or semi-structured data.
- Does not represent data manipulation well.
- Using ER diagrams to integrate with existing databases can be problematic due to differences in the architecture.
- Potential confusion due to different types of notations and methods for displaying relationships
- Depending on the method chosen, it may be confusing for engineers or others that use a different method. Within an organization, it’s important to choose one method and require adherence to the same standard.
 : Can I Use an Entity Relationship Diagram for an Org Chart?
ERDs are not effective for org charts. A better way would be to use Functionly.
You can create complex, beautiful org charts in minutes. With our 'drag and drop' org mapping, it’s easy.
One of the major advantages of using Functionly is that you can build multiple scenarios. This allows you to envision changes to your org structure, such as during periods of rapid growth, and help identify gaps and future needs.
Functionly also integrates with many of the tools businesses are using, such as ADP, Zenefits, QuickBooks, Gusto, Slack, Justworks, Bamboo HR, Rippling, and more. (If you don’t see an integration you need, please request this using our Contact page.)
These integrations allow you to seamlessly build org charts and connect data. For example, you can monitor live headcounts, open positions, and other stats about your teams.
Want to see Functionly in action? Start with a free org chart demo to see how easy it is to be robust and flexible org charts for your organization.
~~
Resources for ER Diagrams:
Image Credits
Title header image: Image created by Functionly.

