Click the links below to head directly to the features you're most excited about:
- Compensation can be managed in the people and positions table
- Enter composition directly in the org chart
6. Bulk editing with CSV re-import
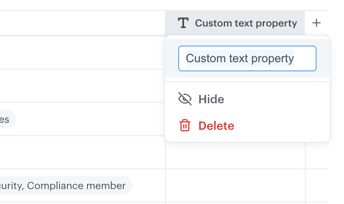
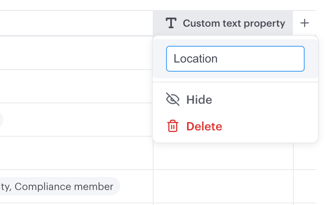
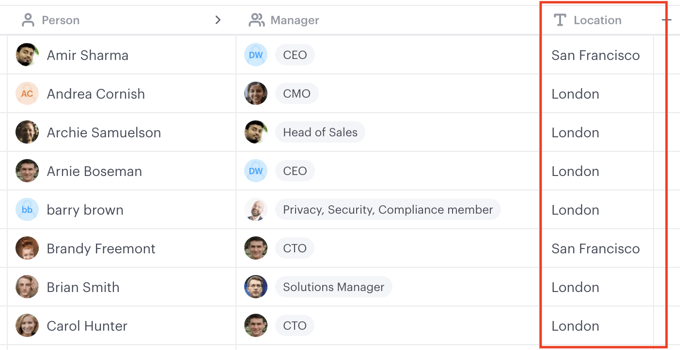
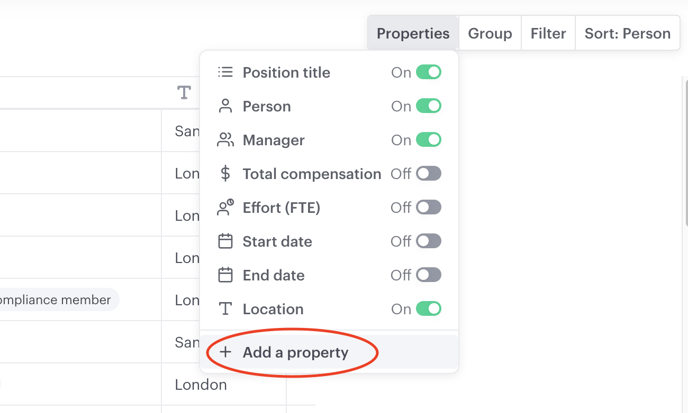
The easiest way to get started is to head to your People and positions table, select the 'Custom text property' column title, and type to rename. Here, we used the classic example; 'Location'.
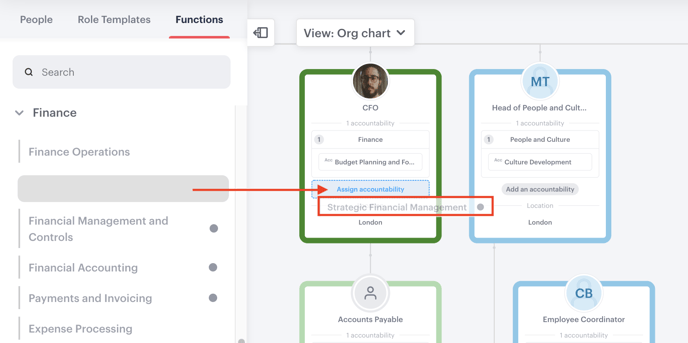
2. Accountabilities view
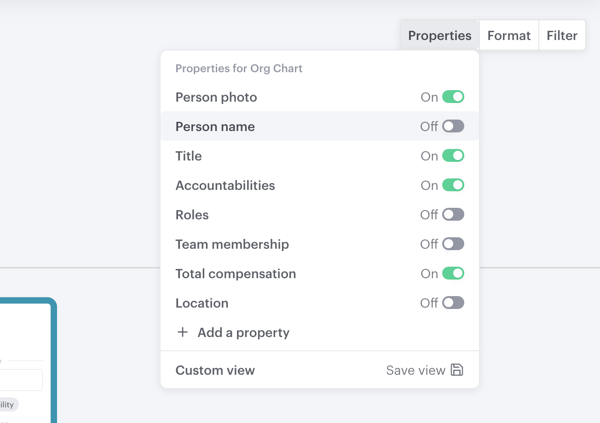
3. Saved views
When it comes to org design, everyone needs different information at different stages. And if time = money, then saved views is a whole lot of dollar bills 💸.
Saved views remembers your settings, including; org layout (wide, condensed, or mixed), any property views toggled on/off, and which teams are/aren't collapsed.
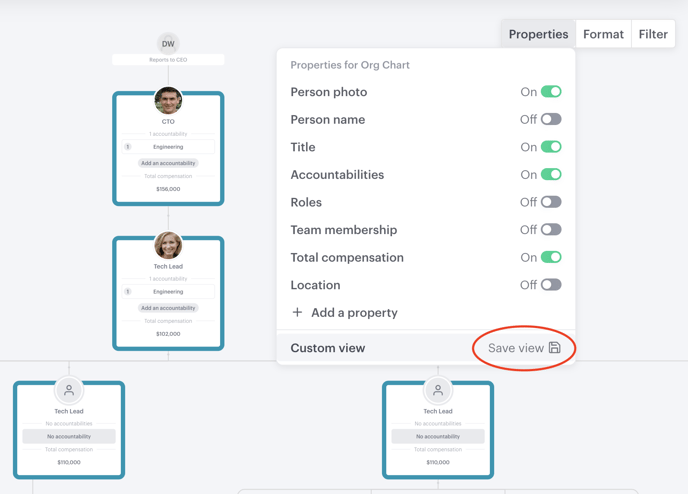
In the view above, we have hidden all positions above the CTO. We have photo, position title, accountabilities, and compensation turned on to get a complete view of the Engineering department.
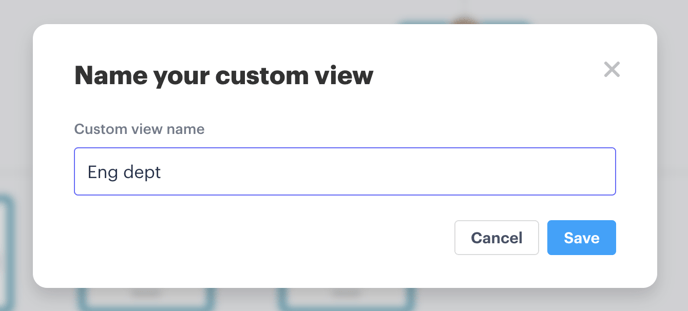
Once you've clicked 'save view' from the properties tab, name your view, then select save.
Your saved view is now easily accessible in your chart navigation menu, and there is no limit to how many you create.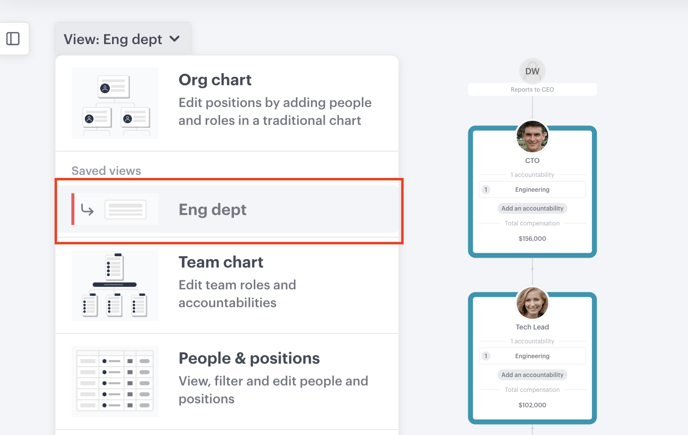
4. Compensation updates
- Manage compensation in your position table
- Add and edit compensation individually directly in the org chart
- Import compensation via a CSV
Compensation can be managed in the people and positions table
The people and positions table has seen a lot of subtle improvements as we work towards being the ultimate tool for your workforce planning. One major change, is in-line editing of compensation.
Firstly, ensure you are viewing the 'total compensation' column, you can do this by clicking on your 'Properties' tab, and switching the compensation toggle on.
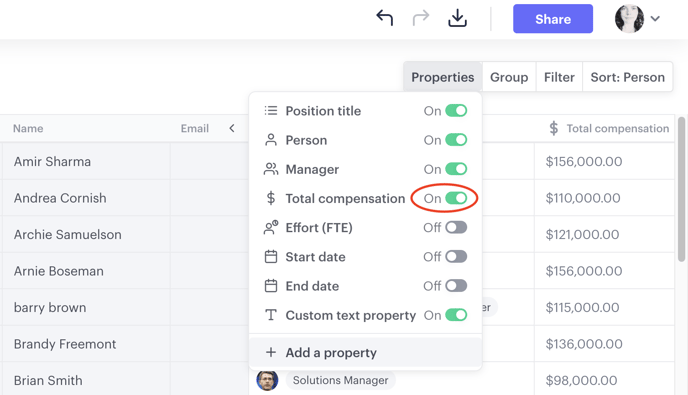
The new column will appear in your table, ready for in-line editing. If you cannot see the toggle option, it may be that you have not been given edit access for compensation, in which case you will need to speak to your team's Functionly account owner.
Enter composition directly in the org chart
Similarly with the people and positions table, compensation is now viewable, and editable, directly in your org chart.
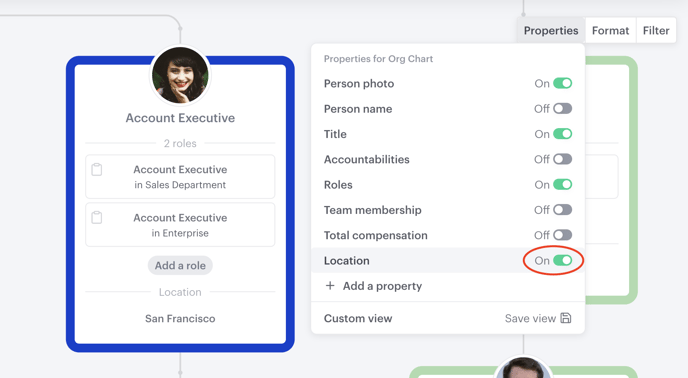
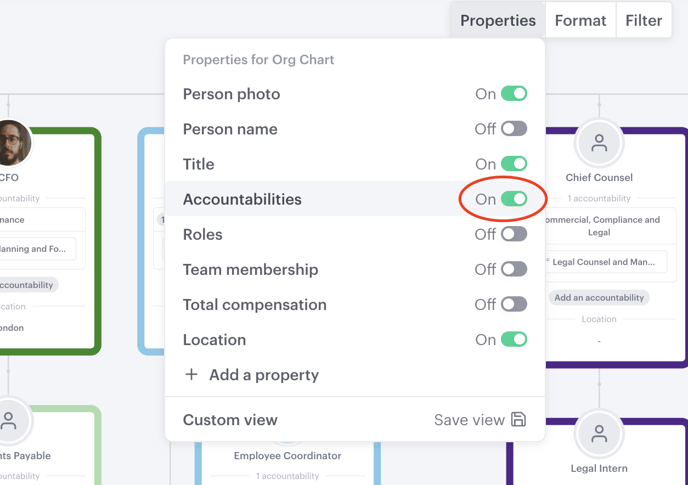
Firstly, head over to the new 'Properties' tab you'll see on the top right hand side of your screen, and ensure the compensation toggle is set to 'on'.
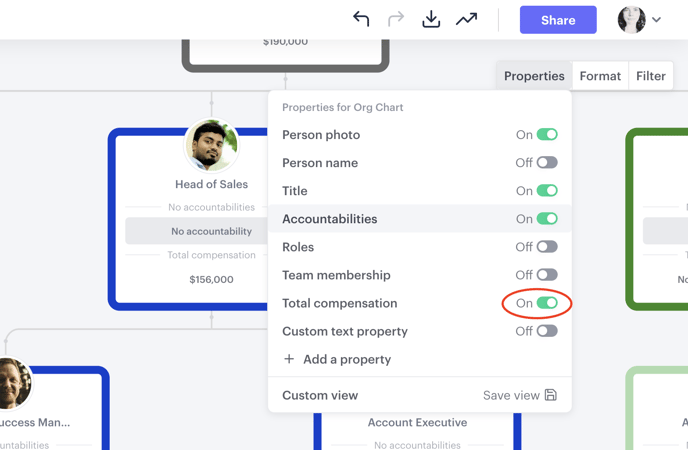
When compensation is 'on' for your org chart, you'll see either 'no compensation data', or you'll see an amount that has been previously added for each position.
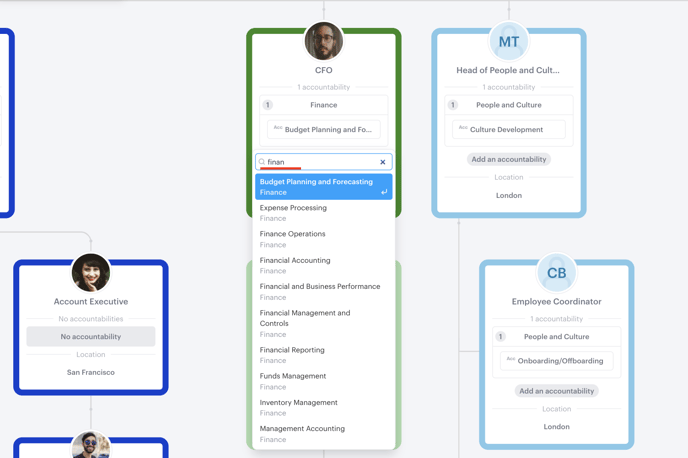
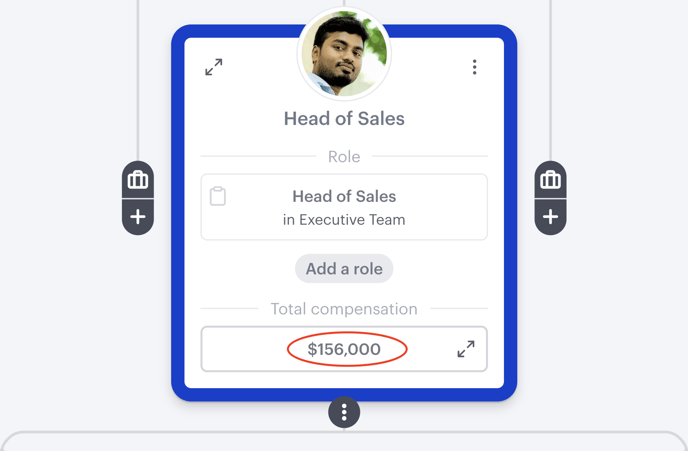
Edit compensation directly on your chart by clicking on the number or text in the compensation field to open the compensation modal.
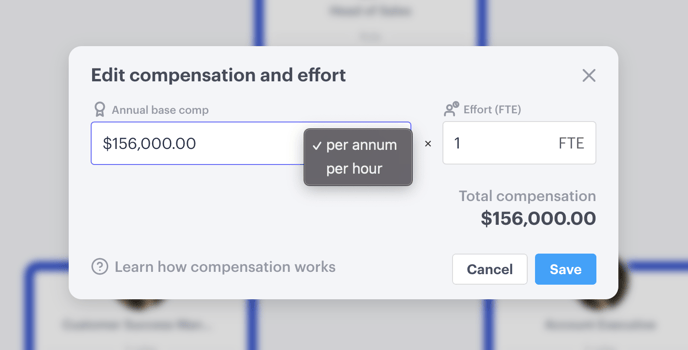
Once the compensation modal is opened, total compensation (per annum, or per hour) can be entered for each position.
If you also alter the FTE (full time equivalent), Functionly will calculate the total compensation, taking FTE into account and will adjust the visible totals accordingly.
Compensation CSV import
Got a larger organization? An easier alternative for adding compensation en mass to your chart is via a CSV import. Follow the CSV people import as per usual, or as per the instructions under 'Bulk editing with CSV re-import'.
Once your CSV is selected, you'll want to double check that compensation has been correctly mapped.
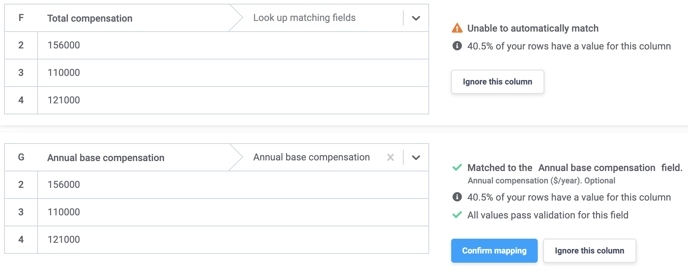
In the above case, compensation has been mapped to the 'Annual base compensation' field instead of the 'total compensation field', which is correct.
One more thing...
5. Table calculations
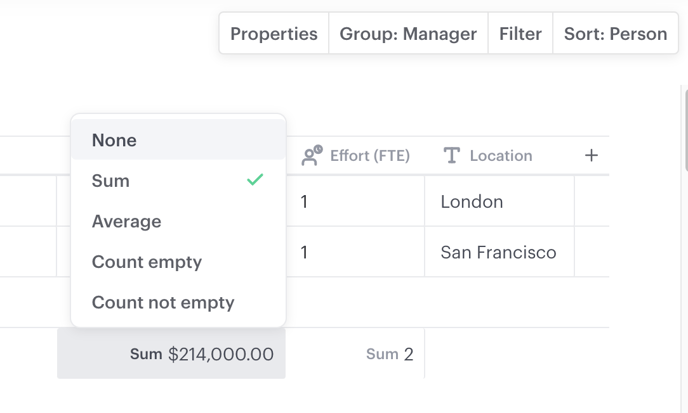
To help you keep a clear view of your workforce, we’ve introduced a calculation footer to the position table, and any grouped sections you're viewing.
Calculations are automatic, and each column footer has an expandable menu to customize the data you see which opens by clicking each footer cell.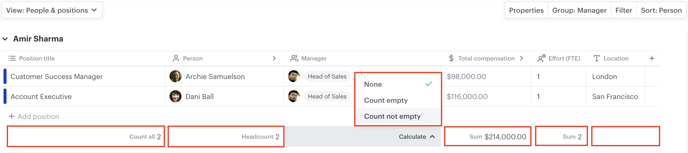
Depending on the data type in the column, you can now quickly see at a glance the calculations for;
- A count of all rows in the title column
- A count of all filled cells in a column
- A count of all unfilled cells in a column
- The sum and average of given numbers or compensation values in a column (like compensation, and FTE)
- The earliest and latest dates present for all date columns
Total compensation, and FTE data are potentially exceptionally useful when using Functionly to plan change, understanding the implications of planned changes, and if the changes are within the financial objectives.
6. Bulk editing with CSV re-import
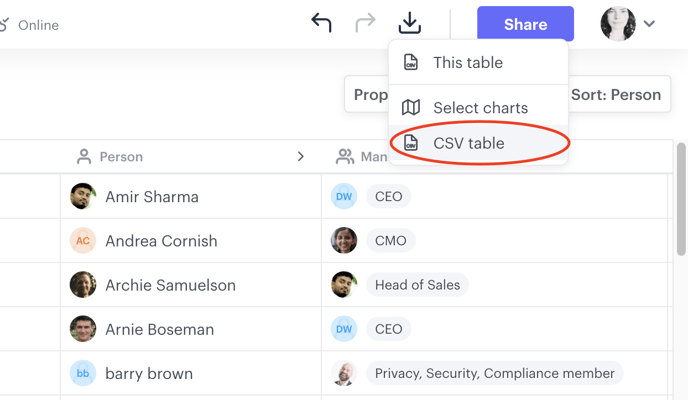
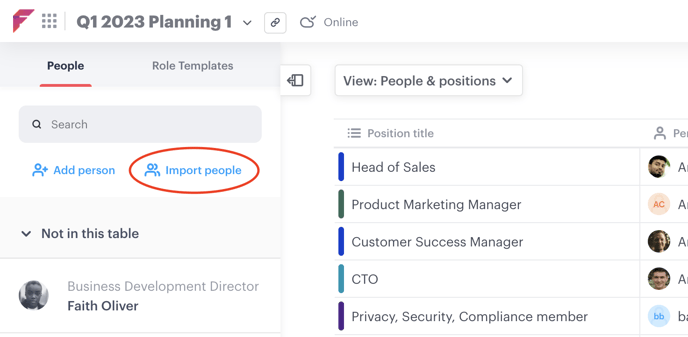
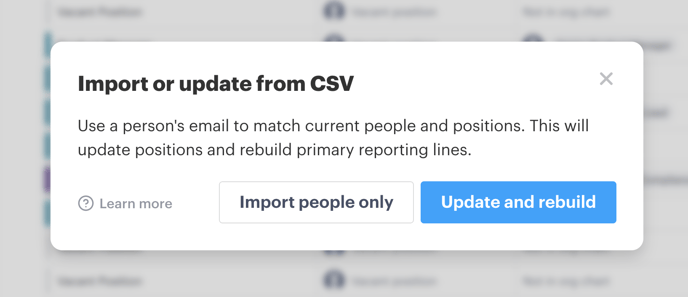
To import newly edited/bulk data, open your slider menu from on the left at any time, ensure the 'people' tab is selected, and click 'import people'. You can then select 'CSV' and you'll be presented with the following modal...
Here, it's important to click 'update and rebuild' to reflect your updates, unless you would like to start building out a brand new chart from scratch.
Bear in mind, this functionality is still in its infancy, so there may be a few additional edits to make to your chart once it has been rebuilt by our system.
7. Chart navigation update
As you might have noticed already, navigation around your chart now looks a little different. As we're adding more views, filters, and options for how you view your org chart, we're also compartmentalizing how you get around.
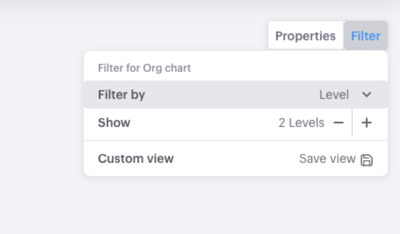
For better consistency between our table and chart views we’ve moved the org chart lens menus out into separate “Properties” and “Filter” menus.
One more thing...