
In July we made iterations to recently released features that were in version one to enhance their power and value:
- Compensation and headcount forecast summary on the org chart
- Group compensation and headcount calculations for your org chart
- Import your own custom properties to the org chart
- Edit compensation, FTE, and vacancy status on the org chart
1. Compensation and headcount forecast summary on the org chart
Initially released in June, the forecast view of your scenario can now be seen in summary form on your org chart. The feature brings together compensation, start dates, vacancy status, among other data to show projected headcount and compensation spend over time. This gives you the power to quickly make changes to your org chart and understand what their impact will be on your compensation budget and headcount over time.
-gif.gif)
To access the forecast overview from your org chart simply click the summary icon 💡 in the top right and click the ellipsis on the top right of the overview box to change the dimensions that are displayed.
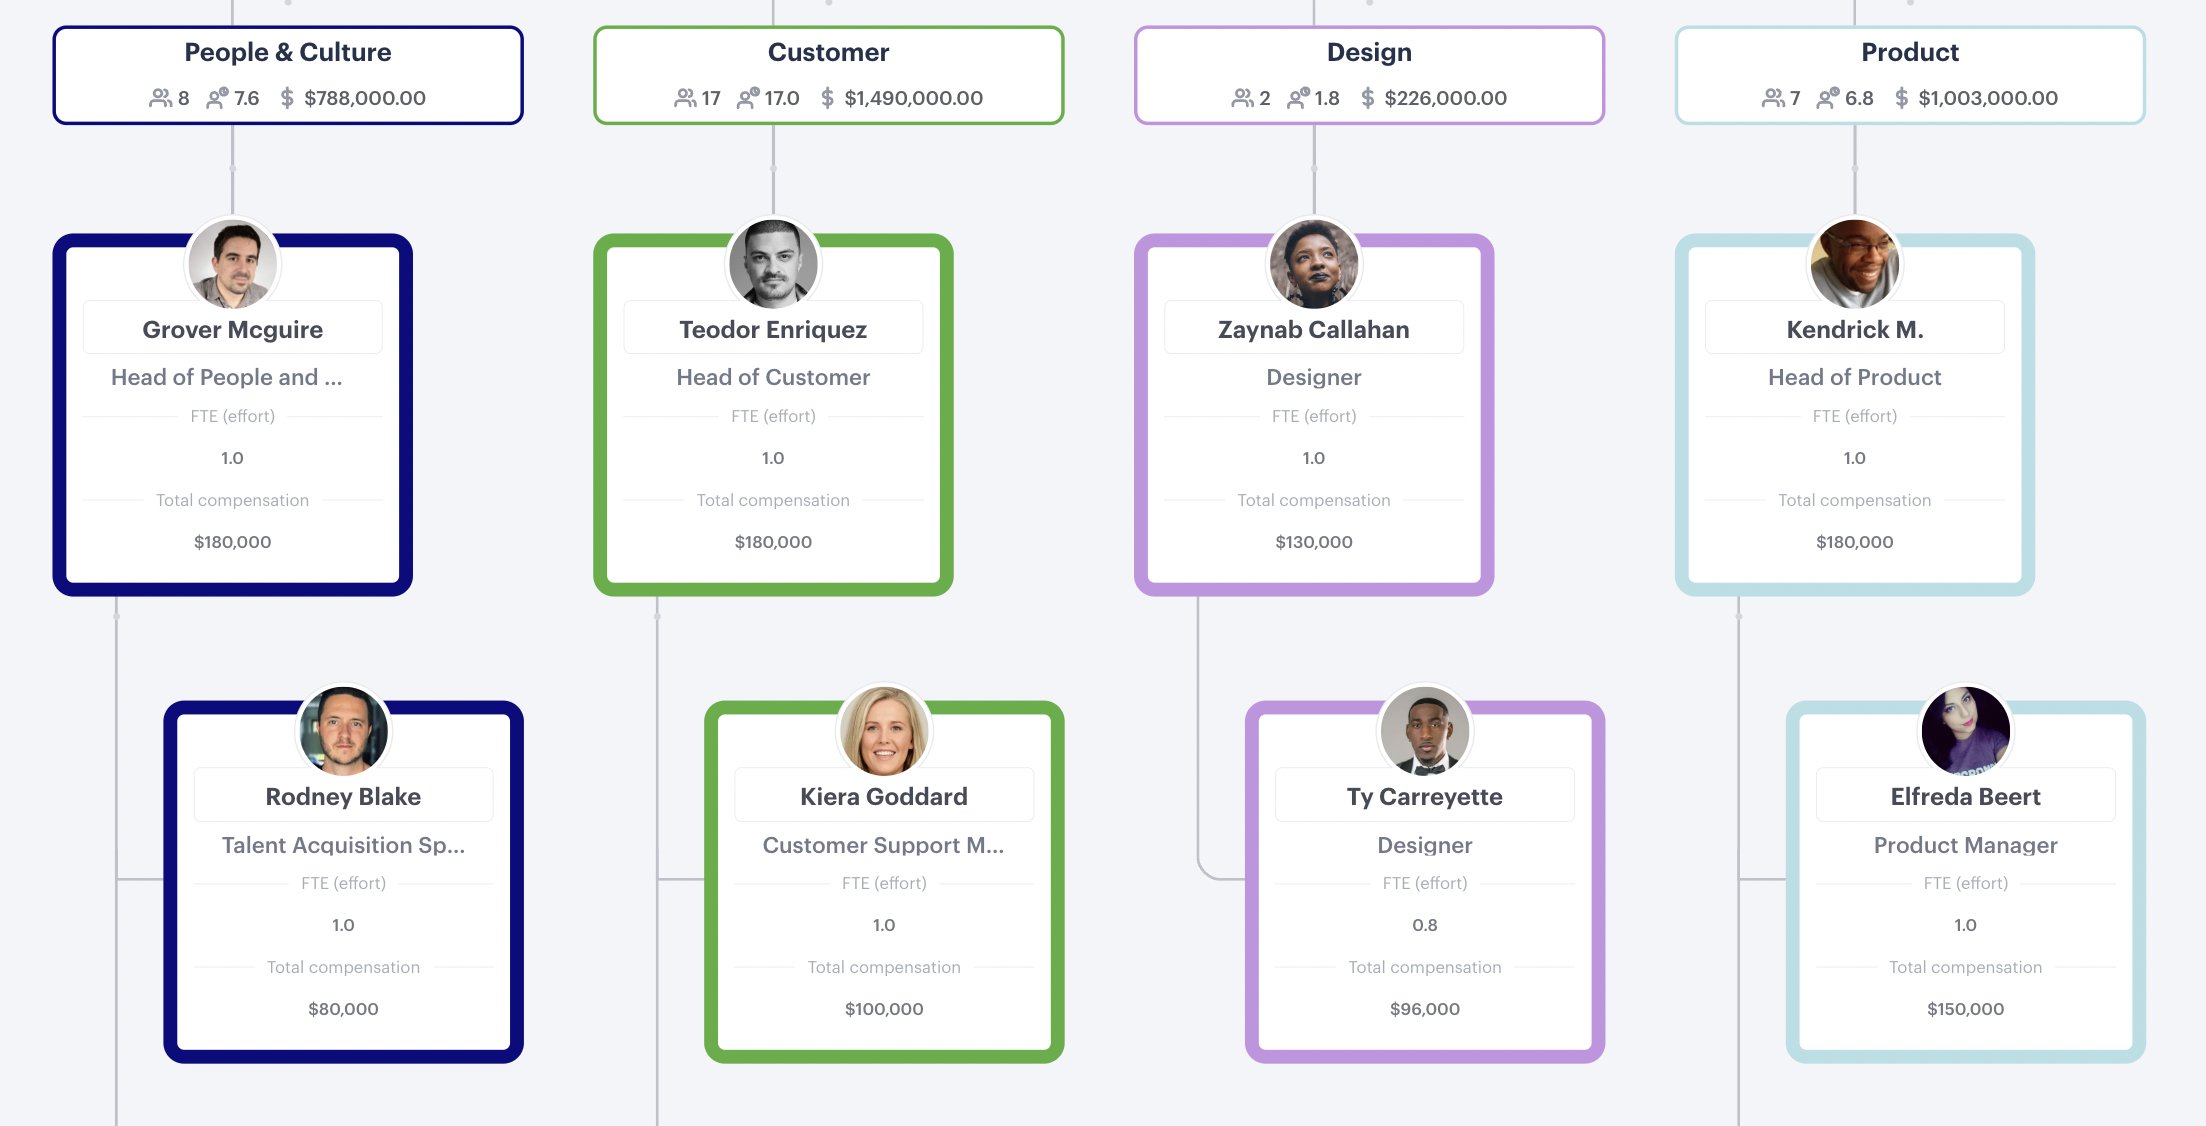
2. Group compensation and headcount calculations for your org chart
In another improvement we've made to a recently released feature, it's now possible to view a summary of valuable workforce planning data for groups such as; person count, FTE, and total compensation. This means that as you make changes to your groups you can, see in real-time, how they impact that group's headcount and total compensation.
To show this information on a boundary or label simply click the "properties" menu and toggle "group calculations" to the on position.
Learn more about how to import compensation data for new or existing scenarios or contact us if you'd like guidance.
3. Import your own custom properties to the org chart
Back in March, we released a new feature allowing users to create and add their own custom properties within the product. Now, these fields can be created and populated during the import process to bulk add them to people on the org chart, rather than doing it one by one.
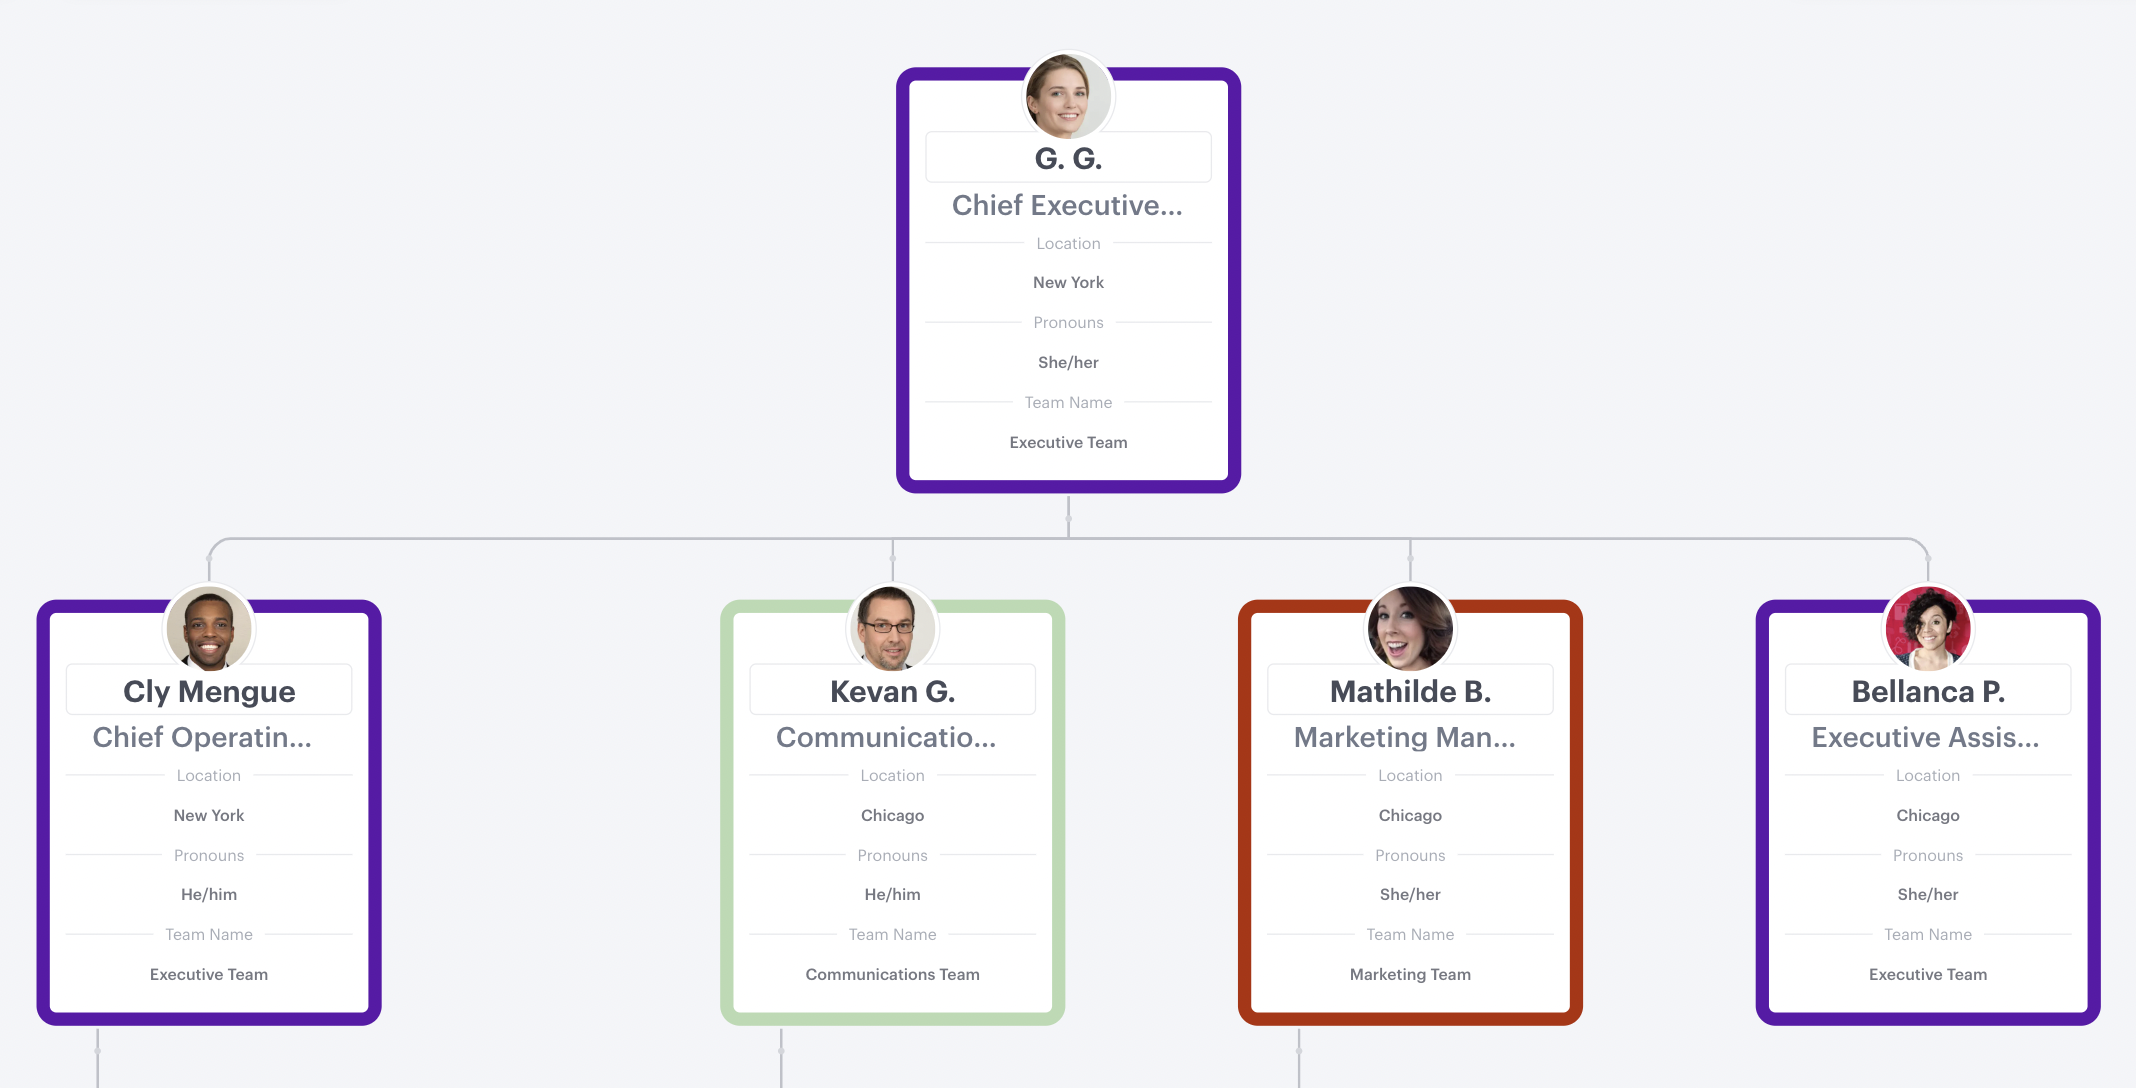
To bulk import a custom field simply select "+ Include as custom field" on the match step of the import process.
Read more about how to import using a CSV here or contact us if you'd like some help.
4. Edit compensation, FTE, and vacancy status on your org chart
After receiving customer feedback that you wanted us to make it easier to change data on a position we have now enabled editing of FTE, compensation, and vacancy status so that you can quickly make changes to individual positions on the org chart. As with forecast summary and group calculations we want you to have all the tools you need to perform effective workforce planning on the org chart.
-gif.gif)
To edit these, or any other available data, simply click the "properties" menu near the top right of your canvas, toggle the desired property "on" and click into the field on the position. As you make changes to the headcount or compensation for a group, the calculations on the group's label will update in real-time.
Click here to check out the release notes for June 2022.

Have feedback or want to learn more about our latest features? We'd love to hear from you using our contact us page emailing support@functionly.com. 🙂