
Contents:
- Add and edit compensation data on your organizational chart
- Bulk import compensation data to a new organizational chart
- Bulk update compensation data for an existing organizational chart
- Tools for your organizational chart and scenario to help manage compensation
- Share compensation with stakeholders
Add and edit compensation data on your organizational chart
In this section:
- Add compensation to a position on the organizational chart
- Add compensation to a position on the people & positions table
- Edit compensation using the org chart
- Edit compensation using the people & positions view
Add compensation to a position on the organizational chart
Steps:
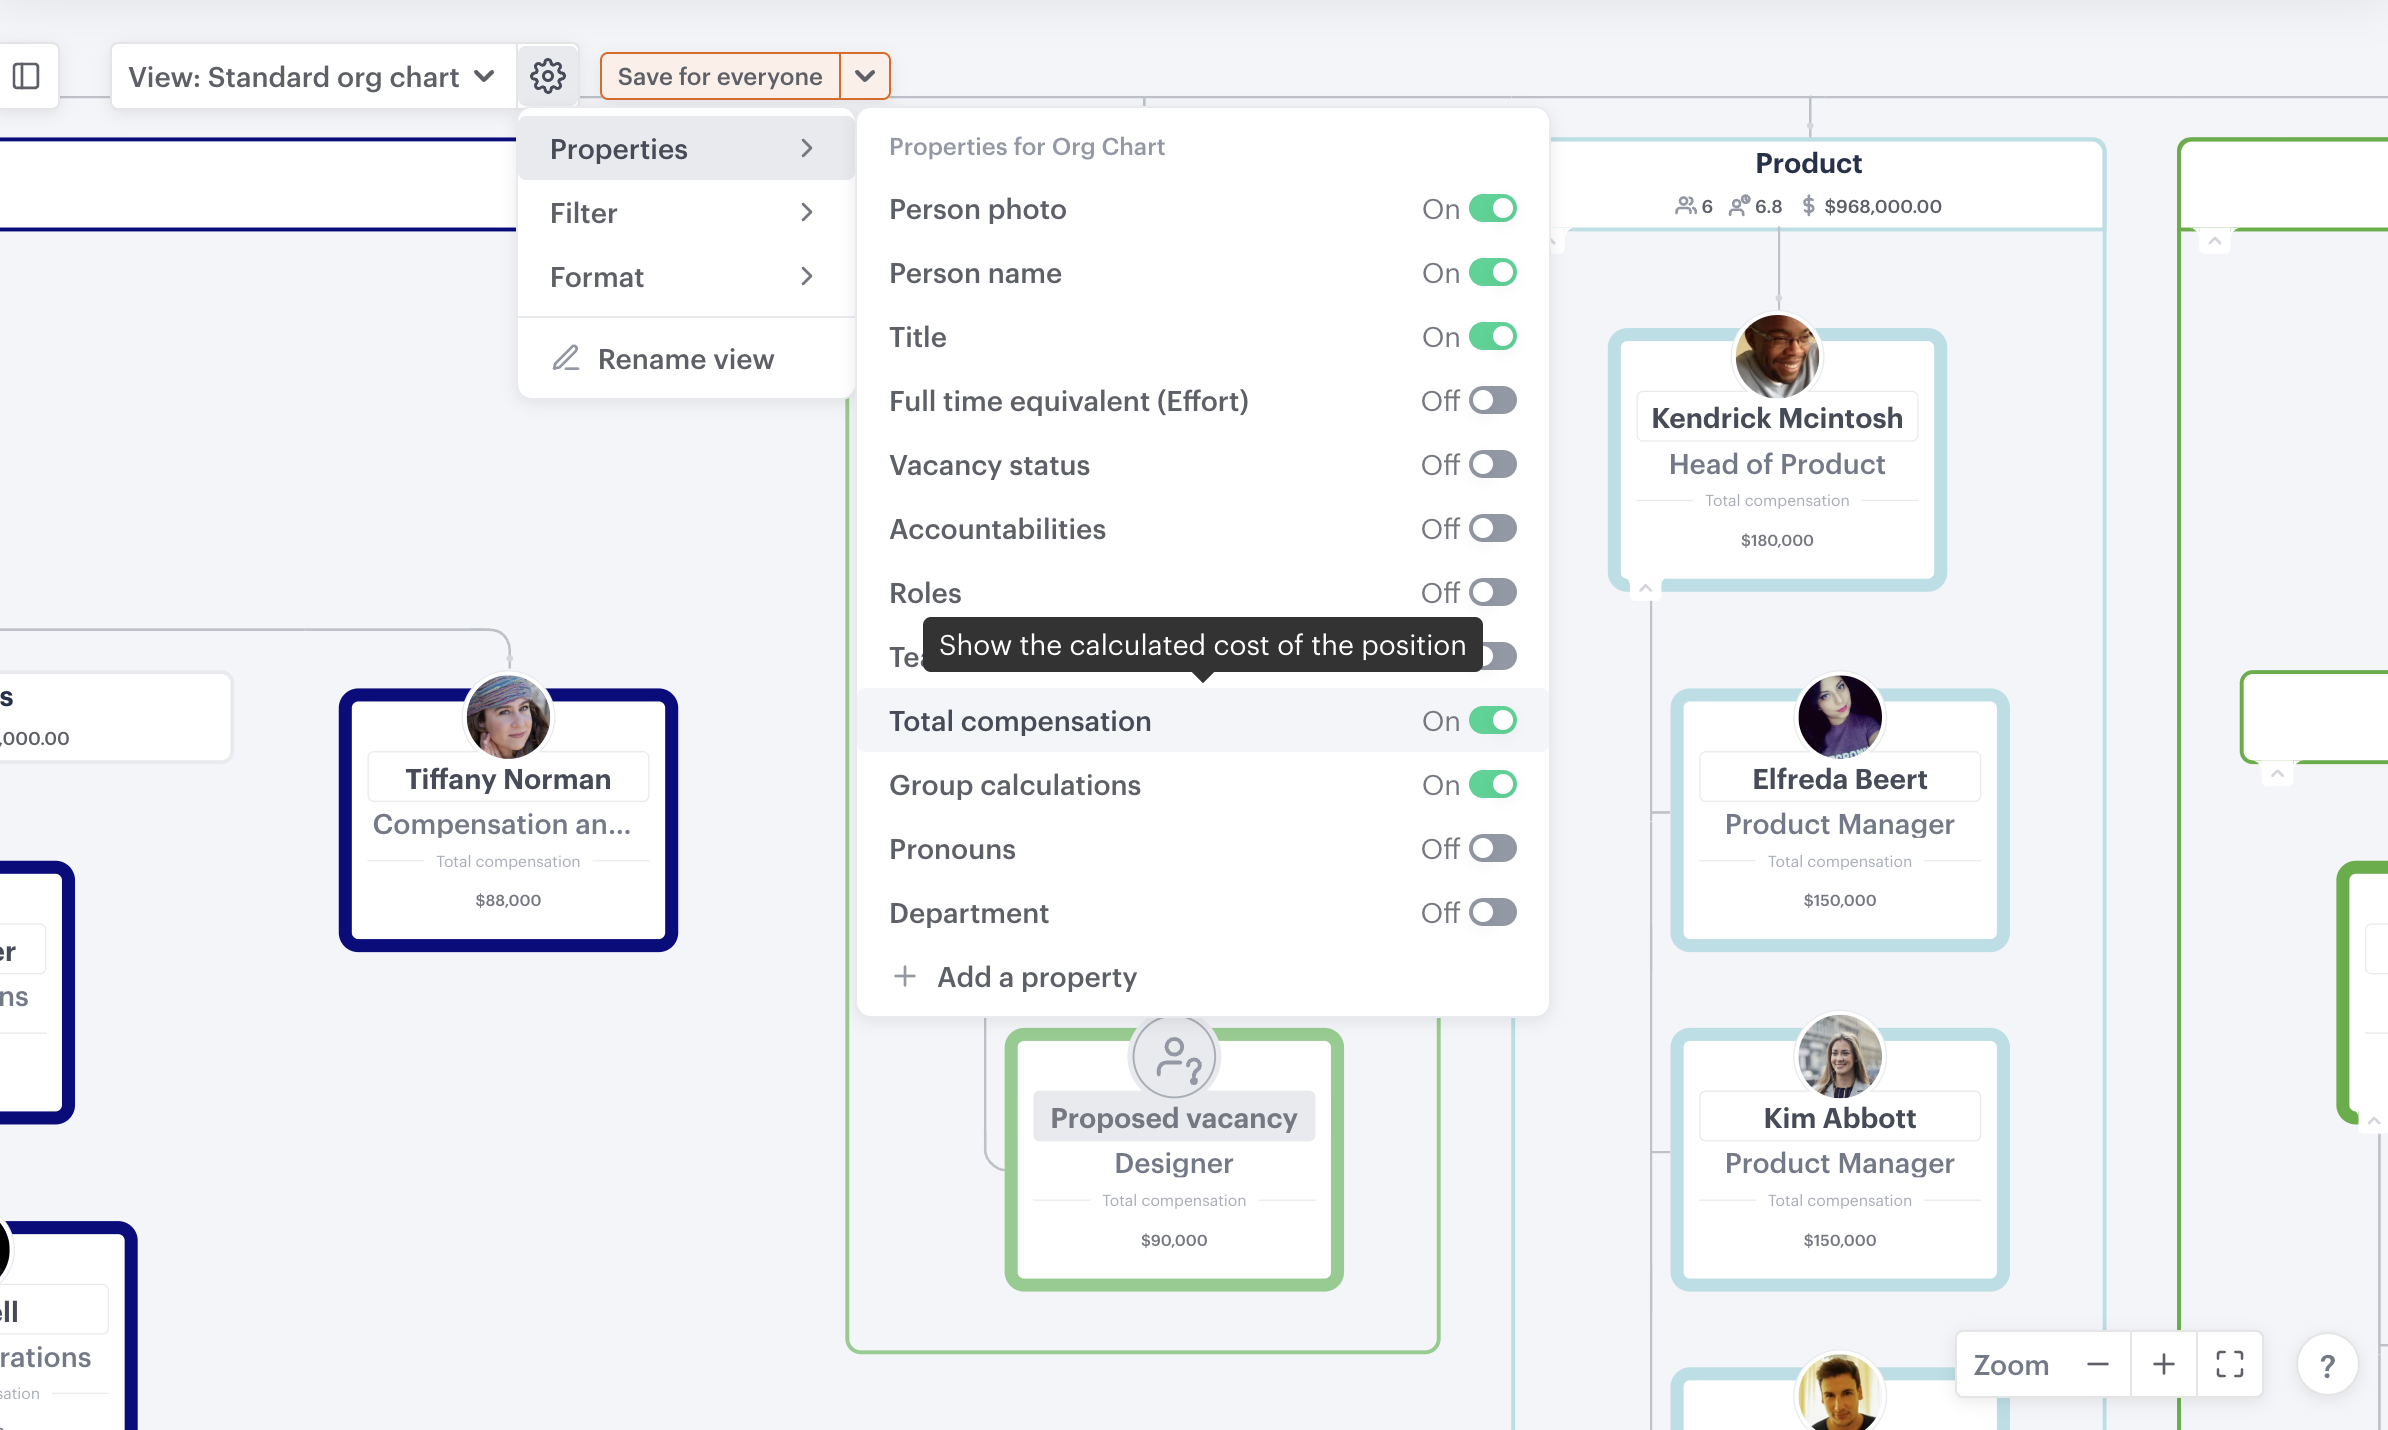
- Click the cog next to the "view" menu
- Hover over "properties"
- Toggle "total compensation" to "on"
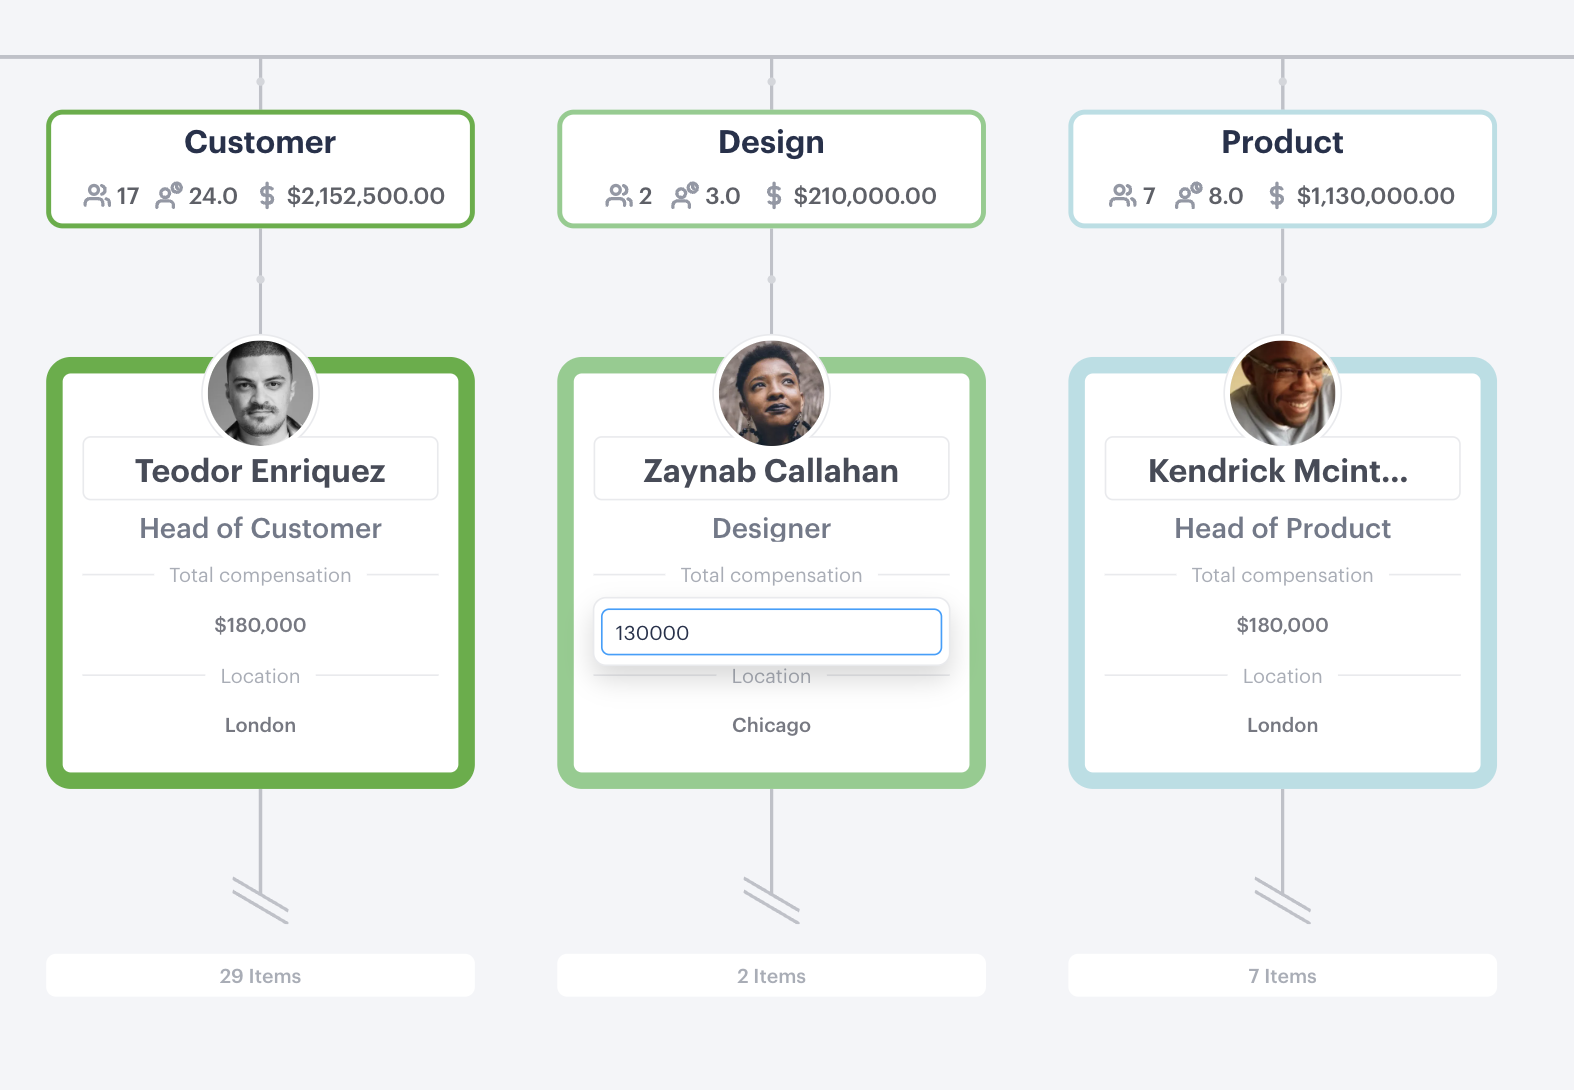
- Click into the "total compensation" field on any position
- Enter the amount and hit return or enter
Total compensation is set to annual by default. You can change comp type to "hourly" on the org chart by clicking on any populated compensation field and also by clicking on the outward arrows on the field.
Add compensation to a position on the people & positions table
Steps:
- Click the "view" dropdown near the top left of your canvas
- Select "people & positions"
- Click the "properties" menu near the top right
- Ensure that "total compensation" is toggled to the "on" position
- Click into any field in the "total compensation" column
- Type in the compensation amount and hit enter or return
Total compensation is set to annual by default. You can change comp type to "hourly" on the people & positions table by clicking the right arrow at the top of the total compensation column.
Edit compensation using the org chart
- Click on any populated compensation field
- Amend compensation, timeframe (annual/hourly), or FTE to update total compensation
- Click "save"
Edit compensation using the people & positions view
- Click on any populated compensation field
- Amend compensation, timeframe (annual/hourly), or FTE to update total compensation
- Click "save"
Bulk import compensation data to a new organizational chart
Steps:
1. Prepare your CSV with compensation included
2. On the homepage click "create a new scenario"
3. Select "CSV" from the list of options to start the import process
4. Select "upload file" and choose your file
-gif.gif)
5. Map your fields including any compensation fields
6. Check for errors
7. Click "next", "yes", "ok"
8. Click the cog next to the "view" menu
9. Hover over "properties"
10. Toggle "compensation" to the "on" position
If you have a mix of contractors and permanent staff in your organization then you can use a combination of annual and hourly compensation, so long as they are set as separate columns in your spreadsheet, and work hours and work weeks are included.

Bulk update compensation data for an existing organizational chart
You can match the people in your spreadsheet to people on your org chart using email addresses or "Functionly Position ID". If you you have created your own spreadsheet to import then email addresses is more suitable.
Alternatively, if you export a CSV of your scenario, you can add compensation data to the exported version and use "Functionly Position ID" to match people in the spreadsheet to people in your existing scenario.
Steps:
1. Export or open your CSV
2. Update the compensation data and ensure email address or "Functionly Position ID" are included
3. Open the scenario that you would like to update compensation data for
4. Click "import people" above the top position in your chart or on the left-hand menu
5. Select "update"
6. Click "upload file" and choose your file
7. Map your fields including any compensation fields but do not map "manager"
While mapping "manager" during the update process shouldn't change your reporting structure, it many result in groups being altered if you have added them to your org chart.
8. Click "next"

9. Check for errors and resolve any that appear in red
If you see email addresses or Functionly Position IDs that are shown in yellow, it most likely means that the import routine has mapped that row of the CSV to a position in your org chart. Hover over the field on the modal to view a message to confirm this.
10. Click "next", then "yes", and "ok"
11. Click the cog next to the "view" menu
12. Hover over "properties"
13. Toggle "compensation" to the "on" position
Compensation tools for your organizational chart and scenarios
Each view of your scenario has tools that leverage compensation and other data to provide you with insights that are relevant to that particular view.
In this section:
Group calculations on your organizational chart
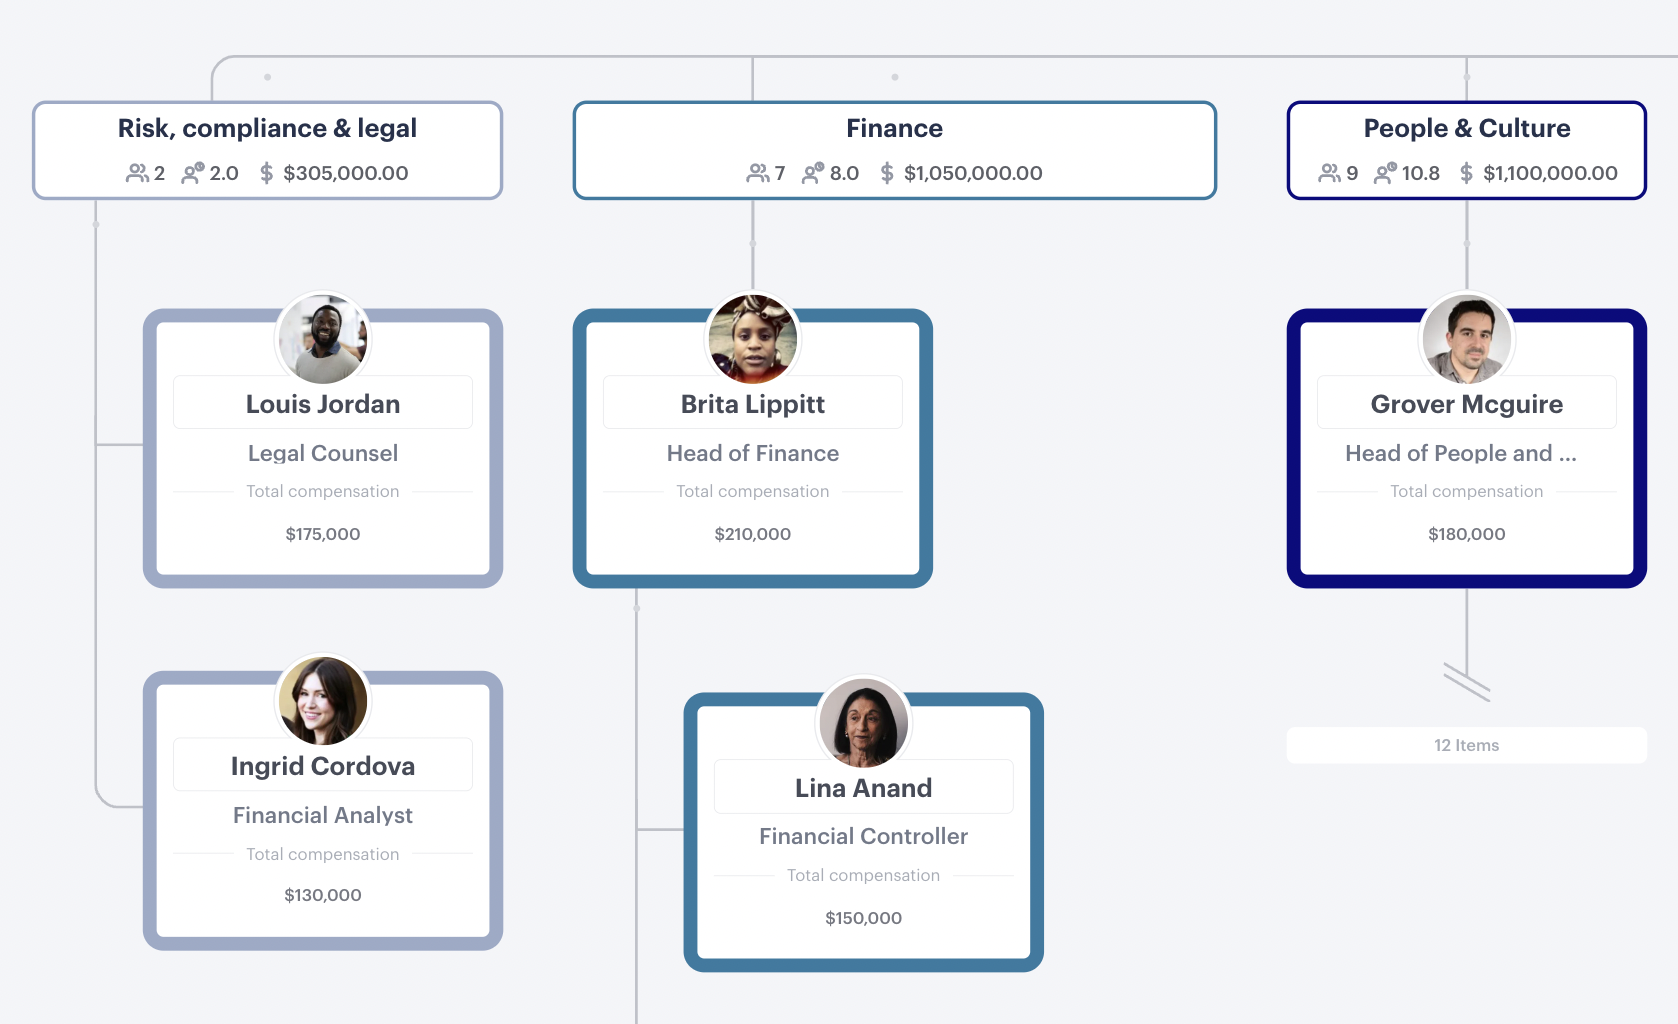
As you make changes to any group on your organizational chart, group calculations allow you to see in real-time the impact your changes will have on its compensation total.
To switch on group calculations
- Click on the cog next to the view menu
- Hover over "properties"
- Toggle "group calculations" to "on"
Forecast sheet
The forecast sheet brings together vacancies, start dates, compensation and a wealth of other data to allow you see how your organization's compensation will evolve over time. To view the forecast sheet, simply click the view menu near the top left and select "forecast sheet".
Learn how to use color to view compensation by team, department, or other breakdowns that matter in your organization.
Forecast overview
If you're making changes to your org chart and want to see a snapshot of the forecast sheet as you go, clicking "summary" 💡 icon near the top right will show a forecast overview at the top of the menu that opens. The dimensions displayed can be changed using the ellipsis on the top right of the forecast overview panel.
People & positions
The people & positions table allows you to order and filter data to show it as you would like it to appear. For example, if you're doing workforce planning and would like to just see compensation for the vacant positions in your organization by projected start date then you can filter "only vacancies" and sort sort by "start date". Once ordered in this way the data can then be exported to CSV and shared with relevant stakeholders.
Share compensation with stakeholders
In this section:
Share the org chart to view compensation
From the homepage:
- Click the ellipsis on the scenario your would like to share
- Select "share scenario"
- Type in the email address of the person you would like to share with
- Set their access to "compensation editor" using the dropdown
- Click "share" to invite them
From a scenario:
- Open the scenario you want to share compensation for
- Click the "share" button in the top right or using the dropdown next to the scenario name
- Type in the email address of the person you would like to share with
- Set their access to "compensation editor" using the dropdown
- Click "share" to invite them
Export to share with stakeholders outside of Functionly
- Open the scenario
- Click the "export" button in the top right or using the dropdown next to the scenario name
- Choose "download csv"
If you would like to order your CSV export in a certain way then you can do so on the "people & positions" view using "group", "filter", and "sort" and then exporting as above.