
Features:
- Copy your current state scenario
- Share with other stakeholders
- Set operating goals for groups
- Add vacant positions and position details
- Track your vacant positions
- Use the forecast sheet to show changes in headcount and compensation spend
- Compare different options to decide which is best
- Export your proposed hires and their data
1. Copy your current state scenario
To effectively plan for growth, it’s essential to have a sandbox environment where you can safely experiment with new ideas and organizational changes. By creating copies of your current state, you ensure you're working with the most up-to-date version of the organization in a risk-free, non-live setting. This allows for testing and refining strategies without impacting real-world operations.

For this step, you will need to understand how to copy, and if you haven't already created a current state scenario, you will need to do this first.
2. Share with other stakeholders
Involving stakeholders in expansion planning ensures diverse perspectives, leading to better decision-making and alignment with organizational goals. Stakeholders, such as department heads and HR, provide insights into staffing needs, skills requirements, and potential challenges. This collaboration helps anticipate resource constraints, fosters buy-in and ensures that the expansion supports the company’s strategic objectives while addressing any potential risks or concerns.

3. Set operating goals for groups
Setting operational goals for groups in your organization, such as defining an ideal headcount or establishing a compensation range, helps clarify where your organization's most urgent hiring needs lie. These targets provide a clear framework for aligning recruitment efforts with business priorities, ensuring that resources are allocated effectively. By setting specific goals, you can better identify gaps, anticipate future needs, and support the organization's growth and workforce planning strategies.

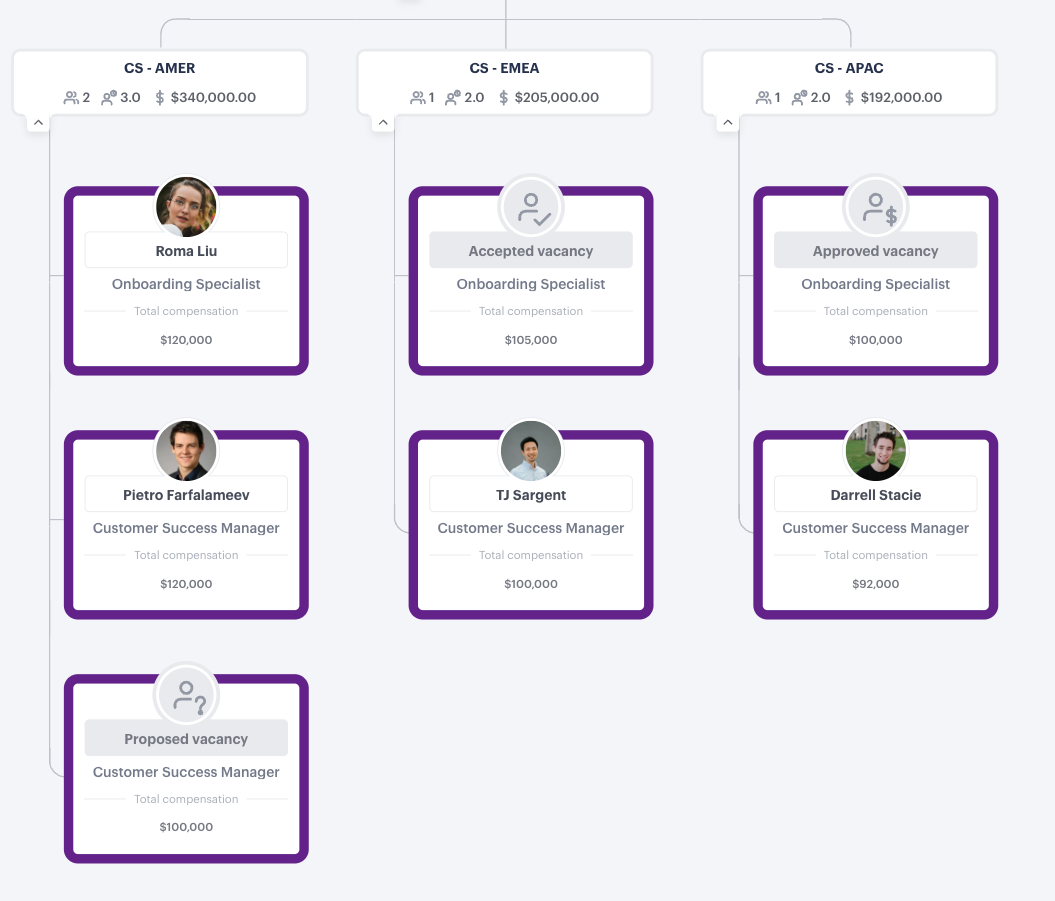
4. Add vacant positions and position details
Adding vacant positions to your scenario will create a visual reference for where each new position fits within your organization. It's also the first step in adding more detail to each position, such as compensation, start dates, vacancy statuses, or even a position description using roles and responsibilities.

5. Track your vacant positions
The more vacant positions you have, the more critical it becomes to track them effectively. For this reason, we strongly suggest adding a Position ID and updating the vacancy status for each position as they progress through the hiring process. These two pieces of information will appear as the name for any vacant position. For example, an Open Vacancy with a Position ID of 1234 will have a name of "Open Vacancy 1234" as well as the position title.

See how to track your vacant positions in more detail.
6. Assess the impact on compensation, FTE and headcount
The forecast sheet enables you to track changes in compensation, headcount, full-time equivalents (FTE), and other key metrics over time. It provides valuable insights into how these elements will evolve, allowing you to anticipate future needs, budget accordingly, and make informed decisions. By understanding these trends, you can better align workforce planning with the organization’s strategic goals.

7. Compare different options to decide which is best
Comparing proposed scenarios for workforce expansion ensures a strategic, data-driven decision that aligns with company goals and resources. Evaluating options helps identify the most cost-effective, scalable solution, mitigates potential risks, and promotes sustainable growth. By weighing different approaches, leaders can optimize workforce productivity, meet future demands, and create a flexible plan that adapts to changing market conditions, fostering long-term success.
8. Export your proposed hires and their data
Whether you want to show your structure with prospective hires included, a list of prospective hires, or to see their impact on headcount and compensation over time we offer the flexibility to export in multiple formats.
